
Investing in Africa's blog, Great Lake Economics, has been increasing the amount of space it gives to explanation and demonstration of new economic ideas in recent months. A motivation has been to bring these ideas to a wide audience in an accessible way. I think that explanation is likely to be more valuable than opinion for developing the region.
A plan for the site's future is to advance the process further, by bringing together and developing the ideas into a formal taught course, freely available online and focussing on Central African economic matters. There are economic courses already available online, and some economic commentary on Central Africa, but they have not been combined in an introductory course as far as I am aware.
I hope that some readers will find the course useful. If visitors, in or out of Africa, would like to see any other information provided on the site, please use the contact address on the site and your requests will be considered carefully.
Sunday, 30 August 2009
Friday, 31 July 2009
Where there is no employment advisor
The BBC has run features on Sierra Leone here in the UK in the last couple of days. Here is one of them. A radio report last night talked of the high rates of youth unemployment.
In a modern economy with reasonably efficient markets, school leavers enter into the workforce and can find work eventually by adjusting their wage demands. In a low income developing country, the jobs may not be available at any wage rate, if they are not created by the school leavers themselves. They often do; African cities are full of young entrepreneurs trying to survive any way they can. A problem arises if the demand for their services and products is not sufficient to provide them with enough to live on, which can happen if the market is not well developed.
Development assistance should aim to move the market to a state where it is well enough developed to allow everyone to earn a living wage. The aim is achieved by setting the economy on its way to economic growth, which involves continuous improvement in one of growth's determinants. The determinants include domestic capital accumulation, educational achievement, market networks, and infrastructure quality. The developmental quality of temporary aid should be judged on whether it starts sustained accumulation of domestic improvements in one or more of the determinants. The quality is not independent of conventional humanitarian aid quality - people are probably not accumulating if they are starving or fighting - but does not necessarily perfectly coincide with it.
The micro-macroeconomic model with borrowing
Here is an extension to the small macroeconomic model described on Wednesday. It includes borrowing. Company profits are given by
P = I - C - R
and company income is given by
I = a*C + b*R.
a and b are constants that may be greater than, equal to, or less than one, depending on how the market and economic growth are interacting.
R is borrowing repaid by the company, and may increase the rate of output. If R falls, then rising inefficiency may be modelled as falls in a and b, decreasing profits. A high interest rate may be modelled as a fall in b, again lowering profits. A government may have a role to play here by increasing the availability of money through spending or printing money if the interest rate is stubbornly high for some reason outside of conventional supply and demand explanations.
Wednesday, 29 July 2009
A compact representation of macroeconomic models
Here's a compact way of representing some of the major variants of modern macroeconomic models.
Companies earn a profit equal to P = I - C where I is income and C is wage costs. Employees receive wages equal to C and spend an amount which generates company income of a*C for some number a. So I = a*C.
A classical analysis may view C as changeable without I changing much. So if a < 1, companies can be made profitable again by cutting wages.
A Keynesian analysis may consider I to be tied more tightly to C because of wage earners' spending preferences. So I falls if C falls, and if a < 1 companies will not be able to make a profit no matter how much they cut wages.
Modifications can be made to the two models, some of which bring them closer to each other. If in the classical model wages are linked to income because of labour market power, then we have the same outcome as for the Keynesian model. In the Keynesian model, if workers do not act on a wage fall - perhaps prices have gone up and they have not asked for a wage rise - the model should move closer to the classical one.
UN refugee data
The UN data service is reporting data on refugees here. I am not sure whether it is a new arrival to the database. The data is of interest in itself, and also as an indirect measure of quantities like political repression in a source or recipient country.
Saturday, 25 July 2009
Estimating output equations using value data
Output equations are commonly used in macroeconomics. They have a leading role in explaining why some countries are rich or have large economies. The equations generally look like Y = f(K,L), meaning output depends on capital and labour. They are usually measured using financial values for output and capital.
The research paper here rejects a common interpretation of the equations when financial values are used in estimation. The argument, in my words, goes like this.
"It might be the case that output measured in physical goods is dependent on machines and physical goods used in production, as well as on labour. But the market value of the output, physical good inputs, and labour could be anything. For example, labour might have a great deal of market power and so be able to charge much more for their services than machine owners could. So the relation between output in physical goods and inputs in physical goods is not well measured by the estimation using values.
"What we do know is that total output is paid to capital and labour. This is an accounting equation, with little economic content. It accounts for the success of equations estimating the output equations; what they are measuring is the accounting identity in an approximate form. The estimated dependence of output on capital tells you little about how physical output varies with physical inputs, and a lot about how much those inputs are paid."
I have not worked out mathematically how people buying the goods would adjust their purchases of inputs faced with different market power of capital and labour suppliers. A non-precise argument is that they would tend to reduce the purchases of the expensive inputs, so the input prices would vary, and so as a result would their market values. Consequently, the equation estimation would be closer to the estimation of the effects on output of physical quantities. However, market values might not adjust perfectly to offset the change in prices - for example, a monopolist supplier of capital would likely see their income drop sharply if they sold part of their capital and broke up their monopoly. This loose argument suggests that the estimation of output equations gives the accounting identity but also partially the production equation.
Growth macroeconomists' research papers often include the assumption of perfect competition, which affects the relation between the physical and accounting equations. The implications of the above arguments are not generally used in analysis after estimations, although it would be a natural insertion into the "robustness section" that often occurs in empirical papers.
If you are interested in the previous arguments, one of the authors has a full directory of their research here, including alternative empirical estimates of the East Asian growth experience, which is helpful as criticism without a different empirical approach can be deflating.
Friday, 24 July 2009
What is hedonic price analysis?
Hedonic price analysis examines goods in terms of their components or characteristics. When shopping, people might consider a food's appearance and nutrition and be willing to pay a certain amount for each. So using hedonic analysis, the total cost of the food would be modelled as
price = appearance * price of appearance + nutrition * price of nutrition
Hedonic pricing helps with assessing how consumers value different aspects of a good. In the example just given, we may be interested in appraising how much people value a food's appearance relative to its nutritional content (some estimates for the valuation of various nutritional elements are given in the research here for United States consumers). If we know about the appearance and nutritional content of a new good that is soon to enter the market, we could estimate its price. The original hedonic equation might have to include a cross-term to make it accurate - consumers might value sweetness and they might value savouryness, but not together. A large negative cross-term sweetness*savouryness would capture their dislike of the combination.
Hedonic pricing also has applications in calculating price inflation and for comparing international prices. We might find that two countries have the same number of computers, but they have different computing speeds. We should make allowance for the different qualities, and hedonic analysis is one way of doing so. Some approaches are described here.
Monday, 20 July 2009
Price elasticities of meat demand in Africa
Economists have used many models of how demand for a type of meat changes with its price and the price of other types of meats. One of the common models is the Almost Ideal Demand System, first proposed in the paper here. If we have four different types of meat, the demand function for the first meat has the form
share in total meat expenditure of meat 1
= a(1)
+ b(1,1) * ln (price of meat 1)
+ b(1,2) * ln (price of meat 2)
+ b(1,3) * ln (price of meat 3)
+ b(1,4) * ln (price of meat 4)
+ c(1) * ln (total expenditure on meat / price index of meats)
Similar equations apply for other meats, and other influences on demand can be introduced into the equations. There are several conditions on how the different equations' coefficients relate to each other. The estimation is often undertaken by the method of seemingly unrelated regression (described here), with one of the equations being dropped to avoid problems that arise because of the conditions reducing the freedom of estimation. There have been other methods built on SUR for handling data of particular forms, such as those which use household surveys.
I estimated the Marshallian elasticities of demand for chicken, beef, pork, and lamb for world countries, dropping the lamb equation. Marshallian elasticities of demand measure how people change their demands for goods if the price of goods change and their income stays the same. My agricultural data covered the years 1991 to 2003 and was from the United Nations Food and Agricultural Organization here. The estimation was on annual data.
The table below shows chicken demand results for the African countries in the data, together with the United Kingdom, the United States, and the world as a whole for comparison. Chickqchickq means the percentage change in chicken demand in response to a change in chicken price, chickqcowp means the percentage change in chicken demand in response to a change in beef price, and similar for the other two elasticities. The elasticities are calculated at the averages of the variables involved.
The own-price elasticities of chicken are generally negative, which is what one may expect; as its price goes up, demand goes down. There are some exceptions, however: Burundi, Gambia, Ghana, and Madagascar. The explanation may be that the data is inaccurate, or the estimation is imprecise for various reasons. However, the estimates may reflect reality in showing a shift in demand. For example, if people stopped rearing chickens over the period (perhaps in Burundi the conflict encouraged people to abandon rearing, or in Ghana quite rapid development led people to work in salaried employment rather than rearing), then there could be a demand shift causing a simultaneous increase in price and demand. In the absence of those variables being included in the estimations, we do not know, but the possibility is interesting. Something similar occurred in the United Kingdom over the same period with a plausible demand shift towards chicken because of health scares associated with beef.
The cross-price elasticities are mixed in sign, and are often negative. As beef prices rise for instance, generally the demand for chicken is found to go down in these elasticities. However, the Marshallian elasticities do not allow for changes in income due to the price changes, and allowing for them (using Hicks elasticities - some of the maths is here) may give positive cross-price elasticities.

Thursday, 16 July 2009
Reasons to mourn the discovery of oil
Sometimes there are celebrations when oil is discovered in a country. Here are some reasons to mourn the discovery, and apply in both well-run and badly-run countries to a greater or lesser extent.
1. It reduces the pressure for formation of capitalist political groupings and democratic institutions.
2. It often leads to autocratic government.
3. It often leads to seccessionist movements in the areas with the oil wealth.
4. It often leads to military movements associated with the seccession.
5. It increases the opportunity for corruption.
6. It increases the pressure for foreign interference in government.
7. It increases the pressure for foreign military involvement.
8. Economic distance can lead to political isolation from major capitalist economies.
9. It reduces the incentive to invest in physical capital.
10. It reduces the incentive to invest in human capital.
11. It reduces the incentive to innovation.
12. It reduces the options to use new techologies.
13. Growth becomes dependent on other people's economies and innovation.
14. The dependence may lower national esteem.
15. It reduces economic diversification.
16. It makes it more difficult for non-oil producers to export.
17. Import earnings are unstable.
18. Government revenues are unstable.
19. The transition after the oil runs out may be difficult.
20. Oil increases global warming.
21. It often leads to inequality and related problems.
The reasons came to me quickly. They seem fairly good reasons. It might be a challenge to see if fifty of them could be reached within twenty minutes.
A private government has no claim on public assets
The Equatorial Guinea government's distribution of income comes in for criticism here, with rapidly rising wealth for its political elites and diminishing living standards for the general population. I find the government's reported ability to take the country's oil wealth notable as the population seems to have no power to get any of it. For me, it raises the question of whether the oil is really available for sale. Unless the politicians own the oil instead of the population, then the politicians are selling something that does not belong to them, exclusively for their own benefit. The buyers are doing the equivalent of handling stolen property. I have a similar concern with a country incurring debt through an unrepresentative leader who disappears all of the money. The lenders lent it to a private individual who took it for private uses. The country has no debt to the lender, and there is a lender liability to the population if the country or population has suffered as a result of the lending. I am not sure if anyone has tried to bring a class action against international lenders in Western courts for pain caused by their negligent actions. It seems not unreasonable to do so, and some lawyers might be willing to take the cases for a fee based on a share of any potential settlement. Some of the liability would be due to foreign governments who advised incorrectly on the legitimacy of the borrower.
No permanent damage from militaries
The news item here describes how African militaries are sharing information on how to avoid HIV transmission among and by their soldiers. The action would help to avoid permanent damage to their host communities. The no-permanent-harm operating principle could avoid heavily criticised activities of armies and militias in Africa: child soldiering, mass rape as a tactic, amputations, wilful destruction of capital, and so on. It doesn't stop looting, rape, and murder that accompany many military campaigns around the world, but does keep the societies more liveable after commanders die or decide that their enemies can be accommodated politically.
Monday, 13 July 2009
The different effects of advanced technology in high and low income countries
A country's output depends on the equipment it uses to produce it, and most equipment works better when it is used by trained personnel, is regularly maintained, and has readily available spare parts. The idea occurs frequently in macroeconomics in the form of technology being specific to a certain set of country characteristics, and has attracted theoretical and empirical support.
Here are some regressions I ran earlier on a model
Output = Constant * capital^a * education^b * technology^c * error
The regressions show the different effects on output of telephones and computers in rich and poor countries. Rich countries might provide much more supportive conditions for operation of these technologies, and so have higher estimates of the coefficient c. So it turned out:

As a moral: advanced technology may become more beneficial to developing countries as they get richer. Early on in development, it may seem that advanced technologies are bringing little benefit.
Sunday, 12 July 2009
How do companies change their capital use when an economy is going through a business cycle?
Economies often go through business cycles, where output expands and then contracts and then expands again. The variations in output during business cycles are quite small, perhaps a few percent, and they only last a few years. Businesses could respond to the downturn by getting rid of their capital or labour, but that would incur sales or redundancy costs, and when the economy turned up again they would probably have to buy or hire again, which would incur new costs. Sales and redundancies do happen, but much of the time it is cheaper for companies to keep their labour and capital the same, and just work them easier or harder when the economy is contracting or expanding, respectively.
Economists using data on capital and labour in estimation face a problem as a result. For example, they often calculate capital manually from investment data or from company purchase costs or in other ways that do not measure how hard the capital is being used. If an economist wants to estimate capital's effect on output, and if we are not allowing for usage intensity, then capital will seem to have a different relation with output that it really does.
Economists would like to know how hard capital is being worked. It is not something that is readily available in statistics. An ad hoc adjustment can be made instead to capture some of the changes in usage intensity, albeit imperfectly. One way is to calculate some simple trend in output, then work out how much higher or lower output is at every time. If output is higher than is trend, then capital is assumed to be working harder than usual, and if output is below trend, then capital is assumed to be working easier than usual and adjustments are made. For example, the paper here (on page 13) uses a simple time trend. It is not a big chore to make the adjustments. For example, the following pseudo-code generates the adjusted capital:
regress gdp on year
predict time_trend=regression_estimates
generate adjusted_capital=capital*(1+(gdp-time_trend)/time_trend)
The adjustment matters. For example, an estimation of output on capital and labour (in log form) gives
ln output = 0.59*ln capital + -0.09*ln education + other terms
(details: world countries, panel data for the 1990s, fixed effect estimation with time dummies)
while an estimation of output with adjusted capital gives more likely coefficients
ln output = 0.46*ln capital + 0.14*ln education + other terms.
Friday, 10 July 2009
Innovation research survey
I came across this research survey here on innovation. It has a broad coverage of the subject, so it is more a classification of research and pointer for further reading, rather than a critical review. Still, I found it helpful.
Uganda and Tanzania's productivity response to international technology
I was going to present some evidence on how these two countries respond to international technology, but the results have lacked coherence. They will be revisited in the future, and presented here. Apologies for the vacant post, but that's how it turned out.
Sunday, 5 July 2009
Applications for MA Economic and Governmental Reform at the University of Westminster
Here's a reminder about applying and getting funded for the Master's course in Economic and Governmental Reform at the University of Westminster here in London, starting in October. I teach the economics modules on the course. African applicants are most welcome and have good performance records.
Our students have come from government, private sector, and NGO backgrounds, and after the course have moved on to senior positions in Africa, Europe, and beyond. Living in London itself offers many attractions and opportunities, of course.
Information on the course and obtaining funding is on its website (here). The course, like most in the UK, is expensive (GBP10,000), so students usually have applied for scholarships first. Course requirements are listed on its website, although there is some flexibility. Unavoidable ones are:
1. Reasonable English (or things won't make sense)
2. A first degree with some relevance to the topic, or a degree and relevant work experience
3. Willingness to work hard (or things will not be enjoyable)
Good luck with application.
Getting the most out of remittances
Many Africans work abroad and send remittances home. I read the World Bank paper here a while back and it appealed for its discussion of remittances' benefits and risks (from page 18). Expatriates may find it helpful in raising the effectiveness of their remittances and other contributions back home.
How do new technologies get into a country?
New technologies may increase output using the same inputs as old technologies. Even if the technology's innovator is powerful in the market, it is probably unusual for them to have such strength that they can take all of the increased output as extra income rather than letting some of it pass to consumers or producers copying the technology. Thus, a developing country may benefit from adopting new technologies from rich countries.
The question is how the technologies get into the developing country. Three routes often examined in the academic literature are imports, exports, and foreign direct investment (for example described in the review here). Strong links with domestic technology have been found with imports from high technology countries, some links with foreign direct investment, and (so I've read, I haven't assessed it myself) few links with exports.
A candidate explanation for the results is that countries' technological improvement is based mainly on importing technological goods from abroad. In this explanation, there may be only a minor role for improved domestic technological expertise in increasing productivity. A alternative sub-explanation allows for increased expertise playing a bigger role, as domestic entrepreneurs study the imported technologies and learn from them. As a possible point against this alternative, several studies using patents have found that innovators tend to base their innovations much more on existing local technologies rather than foreign ones. It may be that local technologies are more suitable building blocks.
The explanation does not give much of a pivot for policymakers wanting to get their population understanding and innovating in new technologies. The explanation is qualified by more detailed evidence from the studies, and also by the broader observation that countries have often moved from lagging behind world leaders to become major innovators, including the United States and Japan. Research on what domestic qualities increase technological adoption indicates that education is important. Education plausibly has more impact on the ability to reverse engineer technologies and copy them than on the ability to use them when they are embedded in imported goods. Although the mechanisms for spread of abstract technological knowledge have not been investigated extensively, the importance of one of the determinants of their success suggests that they collectively are important. Future research may help to clarify how significant are the contributions of reverse engineering, student movement, examining patents and other publications, and personnel movement.
Friday, 3 July 2009
Is there an African economics distinct from conventional economics?
By the question in the title, I mean "are the models and estimates from economics taught in the West suitable for examining Africa's economies?"
When an economic model is presented, it is intended to represent the human behaviour and processes that lead to exchange of goods and money. Many economic models have for a long time assumed individual utility maximisation, that is, people act individually in a way that they choose in preference to other actions. The definition often does not require that people make themselves most happy or most long-lived, but merely that they chose the actions, so the definition is tautological. It is given content by some common assumptions about how utility behaves. For example, if someone is observed to choose to play football for two hours rather than basketball for two hours, then it will often be assumed that they will choose to play football for one hour rather than basketball for one hour. Or, if they choose dancing rather than football and choose football rather than reading, then it is assumed they will choose dancing to reading.
The assumptions can and have been changed in some models. They are flexible, so the method used should be able to describe African economic behaviour. Whether there are adequate models to describe some common situations faced in Africa is a different matter. For example, I will wager, from a position of ignorance, that the number of models describing frequently ruptured, government free, barter economies in the East of the DR Congo is far less than the number of models describing developed country recessions.
That said, even in Africa there are more countries who go through expansion and recession than experience East Congolese conditions. The exceptional circumstances in Africa may be omitted from the Western models, but the models still explain much about African economies. The greater incompleteness of the models may be apparent as a weaker overall fit, or parameters estimated less well. Parameter differences may also emerge if people in Africa make different choices to people elsewhere, on average.
Internal and external sources for epidemic spread
Several countries have had outbreaks of swine flu in recent weeks. Many accounts say that the disease emerged in Mexico, passed to other countries when travellers left, and then started spreading within the new countries.
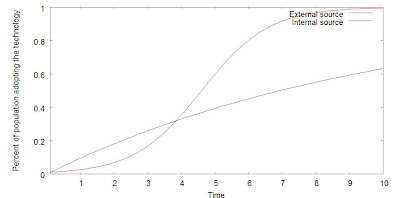
Mexico can provide a steady source of cases for the new countries, limited by the number of people travelling out of Mexico to them. Once in the country, people can pass the disease on to other people. When there are a small number of people with the disease, the rate of internal spread is small, being no greater than the number of people who they meet, and less than the number of people who have brought the disease from overseas. Over time, the internal rate of transfer picks up and overtakes the external source. The exact overtaking time and the pattern of emergence depend on the effectiveness of transfer, number of foriegn travellers, and other factors.
There is an analogy between flu spread and technology transfer. Early on in a technology's life, it may be acquired from abroad for example through trade links. As time passes, people are exposed to the technology through domestic contact and internal transfer can overtake foreign transfer, dependent on factors like whether the technology can be easily learned.
The graph shows the influences of external and internal sources for technology spread along an S-shaped curve. The external source (the straighter line) is earlier more important, and there would be no spread at all without it. The internal source (the curvier line) becomes more important after a while, and accounts for most of the spread from then.

Free financial software sufficient for most economic analysis and presentation
I mentioned in Tuesday's post a good piece of free mathematical software available online. I think that for most economic analysis and presentations in business and academia, it would be sufficient to work with the following bits of free software:
Open Office available here.
Gretl available here.
Maxima available here.
For presentation and common empirical analysis, Open Office is enough. Gretl allows for more complex empirical or academic analysis. Maxima is helpful if theoretical analysis is required too.
Open Office available here.
Gretl available here.
Maxima available here.
For presentation and common empirical analysis, Open Office is enough. Gretl allows for more complex empirical or academic analysis. Maxima is helpful if theoretical analysis is required too.
Tuesday, 30 June 2009
Technology epidemics
When a new technology is invented, the number of people who are using it is often small for a while, then increases quickly, then slows down. Some earlier posts showed the emergence pattern in different countries of ICT technologies (for example, here).
There are competing explanations how the characteristic S-curve arises. One is that people start using the technology as they are exposed to it by other users. When there are few people using the technology, not too many people are exposed to it and it spreads slowly. When more people are using it, exposure is greater and spread is faster until almost everyone is using it and so spread slows again. Other explanations are based on the speed of the technology's acceptance or to its skill requirements and the distribution of people's skills.
The explanations give the same predicted curves, but the implications for technology policy are different. If technology spread is limited by exposure, then a policymaker may best promote it by publicity or other measures to increase knowledge of it. If on the other hand, spread is limited by skills, then training is the best way of promoting it.
For readers interested in the mathematical models, Wikipedia has a page on them here. The derivations corresponding to each of the above explanations would be a little different, but the outcomes are similar. The models are also used in modelling disease spread, so are very useful for comparatively little work.
Free good-quality maths software
Maxima (available at no charge here) does maths analysis, and lots of it: integration, differential equations, simplifications, graphs, roots, and more. Thanks to the public spirited providers. There is science and other software on the host site, SourceForge, but I have only looked at a fraction of it to date.
Contender for charity of the year - Toilet Twinning
A strong contender for charity of the year is Toilet Twinning (here). You pay £60 and your toilet is twinned with one built with the money in Burundi. You get a picture of the unique latrine. That's it.
The project is run by a major UK charity, so presumably its value-for-money is comparable to other aid projects. But even if the money was being burnt; even if it was being used for palaces; look at the logo...

I have no affiliation with Toilet Twinning, and they had no connection with this post.
The project is run by a major UK charity, so presumably its value-for-money is comparable to other aid projects. But even if the money was being burnt; even if it was being used for palaces; look at the logo...

I have no affiliation with Toilet Twinning, and they had no connection with this post.
Friday, 26 June 2009
Pressing the economic spring in Eastern DR Congo
I wrote in a previous post that Western DR Congo could and should develop economically as rapidly as possible despite the fighting in Eastern Congo, even if no adequate solution can be found for the East. The advice leaves open the question of what to do there.
I have been thinking about the description in my recent post on output (here) of how some economies were like coiled springs when the government enforced conditions that varied from growth maximisation. The economies had high levels of technological knowledge or education, but restrictions on accumulation. When the economies transitioned to an open capitalism, they experienced rapid growth.
There is a parallel between these countries during their pre-maximisation stages and Eastern Congo, in that private accumulation of fixed physical assets is very difficult there because of the conflict. So preparatory human capital and technological skill accumulation might be a way of preparing the economy to bound forward after the end of conflict.
My idea is not advanced at the moment, and I am trying things out. I think that it might turn on flexible education, creating the conditions to promote such education, and exposure to international technology.
Is female parliamentary representation or professional representation more associated with greater gender equality?
My previous post (here) looked at the UN's gender equality measure (GEM) and its components. Across countries, there was not a strong relationship between parliamentary representation of women and their representation in professional and technical jobs. I decided to look at the relation in more detail.
The first graphics show the ratio of women's share in parliamentary seats to their percentage representation in professional and technical jobs. For ease of representation, I have split the data into two graphs, showing high and low ratios. At the top of the list comes highly gender equal countries in Northern Europe, as measured by the GEM, highly unequal countries in South Asia, and a scattering of other countries including the two East African countries of Tanzania and Ethiopia. At the base of the list is low gender equality former socialist countries and Middle Eastern countries.


The third graph shows the ratio plotted against the GEM measure. As the ratio of parliamentary representation to professional representation increases, gender equality increases but more slowly than the ratio.

The relationship between the ratio and GEM appears to be non-linear, so I took logs before regressing GEM on the ratio. Including the three South Asian countries of Pakistan, Nepal, and Bangladesh weakened the relation considerably and were dropped. The outcome was a good-fitting relation
ln(GEM) = -0.12 [0.06] + 0.40 [0.06] * ln(parl/prof) + robust error
(R^2=0.61; n=78; s.e.s in brackets)
or GEM = 0.89*(parl/prof)^0.4, with some error.
The regression and graphs raises some questions:
1. if there is a causal link for parliamentary representation increasing gender equality more than professional representation does, or
2. if it is the other way round, so gender equality brings increased parliamentary representation above increased professional representation,
3. why East Africa (and into the Great Lakes regions too) have high levels of female parliamentary representation,
4. why in South Asia parliamentary representation is associated with less gender equality than elsewehere, and
5. why former communist countries have far more professional equality than political equality.
[A technical clarification on spurious regressions:
I thought a little about the estimation ln(GEM) = -0.12 [0.06] + 0.40 [0.06] * ln(parl/prof) + robust error. There is a technical issue that many readers may wish to ignore, but I should really clarify to avoid misleading impressions.
GEM has a form (approximately) like parl+prof+another term. ln(GEM) may be roughly approximated as parl+prof+other term. ln(parl/prof) may be roughly approximated as parl-prof. Thus we have a regression that looks a bit like parl+prof = a + b*(parl-prof). Now if parl and prof are independent, we would have a regression estimate for b (assuming parl and prof are zero mean to simplify the algebra) of sum((parl-prof)*(parl+prof))/sum((parl+prof)^2). Taking expectations and using limiting theorems we have b=sum(E(parl^2)-E(prof^2))/(positive number). If E(parl^2) does not equal E(prof^2) then we obtain a positive coefficient for b. It has arisen solely by virtue of the algebraic manipulations used; any two variables parl and prof would serve equally well.
If there is a further relationship between parl+prof and parl-prof not produced solely by manipulations, then by the reverse argument we would have parl and prof not independent (perhaps this statement could be made more precise). Now the observation made in the earlier post was that there is not a strong relationship between the two; in fact correlation is very low. But looking at their graph, there seems to be a relationship over much of the variables' domains. So the variables do not seem to be independent, although having a low correlation. Thus, the relationship between ln(GEM) and ln(parl/prof) does not seem to be spurious.]
freerice.com expands to foreign languages, maths, science, and art
When last featured on this site, freerice.com was giving charitable donations of food if visitors to its site performed well at a quiz. Back then, one had to say what English words mean. Now the site has been expanded to quizzes about other languages, maths, chemistry, and art. I like, j'aime, yo gusto.
Monday, 22 June 2009
Changing food production techniques
For the food production techniques in a country to change, its food producers must know about the possibility of changing, have access to the alternative techniques, and decide that the benefits of changing are greater than the costs. The costs of changing are often discussed in the literature on technology transfer. Features that are relevant to costs include:
- whether the new techniques are suitable for the company's available productive resources (for example access to water),
- how much finance and capital is required (techniques requiring very large-scale production may be unsuitable for instance),
- how much knowledge is required and its learning costs,
- how geographically distant the company is from expertise about the technique,
- how much support and advice it can get,
- whether the techniques are associated with the use of commercialised or free products (for example in using genetically modified seeds),
- and whether the techniques are socially suited to the area (for example meat rearing in a certain way may have social meaning).
For a private company, the benefits can be measured as income, which depends on end product market demand. When technology transfer research examines the product market, it is often by assuming a simple form of substitution between the new technology's product and the old technology's product. For particular forms of food, more sophisticated modelling of the end market is possible. The demand for the end product is influenced by factors including:
- price,
- the exact type of the product (for example the type of coffee),
- preparation given to the product (for example by cutting into chunks before selling).
- nutritional content,
- safety (some foods being associated with more health risks than others),
- public information about the product's benefits or risks,
- appearance,
- perceptions of naturalness and wholesomeness,
- advertising and branding,
- place of consumption (for example in a restaurant or at home),
- social context (some foods may be considered suitable in certain circumstances, for example holidays),
- familiarity,
- habit,
- and population demographics.
The chances of a technique being successful in a country depends on the cost and benefit factors being favourable for profit. Other things being equal, shifting a single factor in favour of the technique will make it more likely that it is successful in the country. So a technique where the knowledge requirements are not excessive in the country is more likely to be successful than one where great knowledge advances are required. A technique which does not create health concerns in the public is more likely to be successful than one that does. Countries have different circumstances, and no single technique can be successful in every country. It matters to choose techniques well.
Localisation of spillovers of gender equality, by component
A recent post here looked at whether gender equality spills over international borders, where equality is measured by the UN's gender empowerment measure. The finding was that it does a little, but the effects fall off quickly with distance. National income and other factors are much more important than international spillovers.
Today, I split up the measure into its components: the percent of seats in parliament held by women, the percent of professional and technical workers who are female, and the percent of professional and technical workers who are female. The GEM measure corrects for the proportion of the population who are female, whereas the plain components I use do not. Then the same estimations were run as in the previous post. The table shows the results.

The spillovers from international equality are weak for the components. The strongest spillover is among levels of equality in professional and technical work, perhaps because the factors embodying business institutions are more substitutable across countries than the factors embodying parliamentary institutions - a businessperson may find it easier to be a businessperson in a neighbouring country than a parliamentary representative would to switch parliaments, for example.
The explanatory power of the component regressions drops sharply compared with the full GEM model. Only parliamentary representation is explained to any extent by the model. Part of the drop is probably due to the correction for female proportions in the full GEM measures. A bigger part is plausibly caused by the weak correlation of the three components across countries. A country with a high professional equality has almost no tendency to increased parliamentary or legislative equality. Equality in one country in one component of the GEM may be related to equality in a different component in a different country.
Surfing Liberia
Friday, 19 June 2009
How much is my country's capital worth?
Capital is the physical equipment and material used in producing new goods. It is made by investment. Much research has found a link between a country's capital and its output, and so there is a link with investment too. Investment is something that can be changed by a country, and so other things being the same, a country can alter its output too.
If output grows quickly when capital increases, then investment is even more important. To find out how strong the link is, we have to have good measures of output and capital. Output is relatively easy to work out since much of it is sold every year so it can be found by surveys, amongst other means. For capital, it is trickier, since it is not completely sold every year.
One method of finding out the capital in a country is to ask everyone and every company what equipment they have, and then work out its value by looking at the market prices for the equipment, if it is still sold. The method will be time-consuming and expensive, if it is possible at all.
An alternative method is to say that investment makes capital, so to estimate a country's capital we can add up its past investment in some way. Many writers assume that investment goes straight into capital, so 10 francs of investment become 10 francs of capital. They also assume that past investment becomes less valuable every year. 10 francs of capital made this year are worth more than 10 francs made a year ago, which is worth more than 10 francs made two years ago.
Old capital may be less valuable because it breaks. The same equipment in two different countries may break at similar rates. It may also become less valuable because it is used to make a product that fewer people want to buy as time goes on. People's preferences may change faster in one country than another if the country has faster improvements in the products it has available. These countries are likely to have high investment rates, too, since high investment is likely to encourage technological change. So high investment is likely to be associated with faster reduction in capital value.
Sometimes, someone might be interested in how fast a country's capital deteriorates physically. At other times, they might be interested in how valuable it is for making new goods. Deterioration rates and whether they are the same across countries depend on how people want use the calculated capital.
There is a research paper discussing these issues here.
People, bananas, dogs, and QSAR
A handful of scientific articles and papers caught my attention in recent weeks.
Population density triggers cultural explosion (here)
The work fits neatly with recent economic studies on localization of technological spillovers and output benefits of employment density (for example, here).
An account of the diseases striking the world's favourite fruit (here)
Bananas are a staple food for many people in Africa, and subject to potentially terminal diseases.
Comparison of dog genes (here)
I asked a while back why dog breeds look dissimilar and cat breeds similar. The paper presents a partial answer, showing gene differences in dog breeds, and raises a dozen further questions.
The quantitative structure-activity relationship (here)
QSAR examines the relationship between a molecule's structure and its chemical properties. I found it interesting in relation to my work on technology, as it helps to show how a company's research can transform into potentially commercialisable property. I wonder if there are similar innovation tools in the other sciences.
Monday, 15 June 2009
Three types of graph commonly used in business and government reports
Some people prefer words to numbers in describing how economics works. Sometimes words are clumsy for description, and graphs are helpful to represent their economic information. A few types of graph occur frequently in academic, business, and government reports, and it is worth being familiar with them.
Scatter graphs (also known as X-Y graphs)
Suppose we have received some data that says that when an economy produced $1000 million of goods, imports were $100 million. When the economy produced $2000 million, imports were $400 million. When the economy produced $3000 million, imports were $1000 million. Looking at the data, we could say that as the economy became larger, imports increased.
We could alternatively draw a type of graph using the data, known as a scatter graph. We draw evenly spaced points on the line at the bottom of the graph, called the x-axis, including the points from the data describing production. We draw evenly spaced points on the line at the left side of the graph, called the y-axis, including the points from the data describing exports. We have joined up the points with a line.

The graph shows that as production increases, so do exports, which is what we said earlier. We can also see that as production grows, exports seem to be getting larger more quickly. We can also guess at what exports would be if the economy produced other amounts of goods, by seeing where the line goes. For example, when production is $1500 million, we can estimate that exports would be about $230 million.
Bar charts
Suppose that we have been told a little more information, that the country producing $1000 million of goods is called Angoland, the country producing $2000 million is called Beninia, and the country producing $3000 million is called Congoroon. We can draw a graph with the countries along the x-axis and production on the y-axis. For each country, we draw a column up to their production. The graph looks like this:

We can see quickly from the graph that Congoroon has the largest production, while Angoland has the smallest. Bar charts can be particularly useful if we have much disorganised data. We can see quickly which countries are the largest, smallest, or near the middle of the data.
Pie charts
Pie charts are another way of presenting the information in the bar chart. Angoland produces a sixth (1000/6000) of the total production of the three countries, Beninia produces a third (2000/6000), and Congoroon half (3000/6000). A circle is drawn, with a sixth of the area marked by Angoland, a third by Beninia, and half by Congoroon, like this:

Pie charts allow us to see quickly how important a country is for production and compare countries, which might not be easy from the numbers.
Friday, 12 June 2009
Income elasticity of ammonia imports in SSA and developing Asia
Here is a test of the importance of industry in developing Africa and Asia. Ammonia is a chemical with wide applications throughout industry, so if a country is substantially altering its industrial production the amount of ammonia it imports is likely to change too. I ran regressions to estimate the income elasticity of ammonia imports (a measure of the change in ammonia imported as income increases) for five industrialising Asian countries and five African countries using annual data from here. The results are in the table. Changes in income generally explain a far higher amount of ammonia import changes in the Asian countries than in the African countries, as measured by the R2 statistic.

The lowest income Asian countries (Cambodia and Vietnam) saw their ammonia imports fall steeply as they became richer. By comparison, the only African country with a strong link between income and ammonia imports (Kenya) has a positive link. A tentative explanation is that the two Asian countries switch to manufacturing their own ammonia imports as they industrialise, while Kenya continues to use foreign imports. Another explanation is that there are different shifts in and out of processes using ammonia across the countries. It would be interesting to know which explanation applies. There might be a market for African chemical manufacturers, given that ammonia manufacture is a well-known procedure (described here).

The lowest income Asian countries (Cambodia and Vietnam) saw their ammonia imports fall steeply as they became richer. By comparison, the only African country with a strong link between income and ammonia imports (Kenya) has a positive link. A tentative explanation is that the two Asian countries switch to manufacturing their own ammonia imports as they industrialise, while Kenya continues to use foreign imports. Another explanation is that there are different shifts in and out of processes using ammonia across the countries. It would be interesting to know which explanation applies. There might be a market for African chemical manufacturers, given that ammonia manufacture is a well-known procedure (described here).
How should a government invest to maximise national output?
Suppose a government has a budget and wants to invest in the economy to maximise economic output. It can choose between educating its population, buying more of its current productive goods such as roads or factories for state owned companies, or researching for new technologies and adopting foreign technologies. Which should it do?
Here is a quick answer that illustrates some of the major principles involved. Let us say that the economy's output is given by a function
Output = Y = A^a * K^b * H^c.
This says that output depends on the technology used in the economy (A), the invested money in physical inputs (K), and the education in the economy (H). The exponential terms a, b, and c describe how output may rise at a different speed to the inputs.
Suppose that the costs of A, K, and H are constant relative to each other, which may be the case if the economy is small relative to the input sources (such as the rest of the world) or if the factors used to make A, K, and H (such as finance and labour) are interchangeable. Then the country has a budget
A+d.K+e.L=f
for some total amount of money f, where d and e are the prices of K and L relative to A. There are several ways for the government to work out how to maximise output when its budget is constrained. One way is to substitute the budget into the output function and then use differential calculus to find a maximum. Another way is first to take logarithms of the output function and then substitute the budget, which is less algebraically complicated, and equivalent since the logarithm function moves up and down at the same places as the original function so will have the same maximum. Another way is to use linear programming, subtracting an undefined multiple of the budget from the output function and then using the Lagrange multiplier approach (described here. This approach is very common in academic work since the algebra tends to be by far the least complicated for big problems).
The solutions are
K/A = b/(a*d) for all f and L/A = c/(a*e) for all f.
So the ratios of the inputs at the maximum output are constant. Investment should occur to keep these ratios constant. The constants a, b, c, d, and e can be estimated from past data, although the estimation might be difficult since: 1) the economy may have changed since the data was generated, 2) the economy may not have a maximal allocation in the past, 3) the data should be for government expenditure, not for economy-wide expenditure and the data may not be available, 4) the assumptions of parameter stability are only approximate, 5) the function for output is an approximation, and 6) there are other reasons too.
The many cautions on estimation just presented show why the answer is rough, but it does have a place when there is an extreme imbalance between the amounts of each input (far more capital in the economy than technology, for example), since then the approximations are less likely to make the broad recommendations wrong. Large imbalances are not uncommon internationally; communist countries often have far higher levels of education than technology for example, so increasing expenditures on adopting new technologies is more likely to promote growth than further educational expenditures. Another example might be in closed economies that tried to import-substitute for advanced Western goods in the past; they built up large technological bases (even if the technology was difficult to observe because of limited capital stocks) and so capital investment is more likely to promote rapid growth than further domestic technological innovation. Such economies are like coiled springs, where political decisions caused deviation from growth maximisation in the past, but were able to correct rapidly to their long-run position on adoption of a growth-maximising approach to the economy.
Economic value added
Economists like to specify production functions that say output depends on various inputs such as capital and labour. They may write Y = F(K,L) or Y = Y(K,L). They also specify a budget, stating how much the inputs cost and how much money there is to buy them, such as a*K + b*L = total funds for purchase.
The output Y is different from the cost of inputs. The difference between the two is the value added in the economy or company producing the output. Value added arises from the organisation of the inputs to produce the output (some economists refer to the organisation as technology, although others keep the term technology for a particular part of the organisation). The value added is taken by the organisers (who may also provide the capital and labour). If Y is measured by K multiplied by L, say, then although the production function mentions only K and L there is still organisation used as the value added is greater than zero. The only time that there is no organisation is when the output equals the cost of the inputs.
The output Y is different from the cost of inputs. The difference between the two is the value added in the economy or company producing the output. Value added arises from the organisation of the inputs to produce the output (some economists refer to the organisation as technology, although others keep the term technology for a particular part of the organisation). The value added is taken by the organisers (who may also provide the capital and labour). If Y is measured by K multiplied by L, say, then although the production function mentions only K and L there is still organisation used as the value added is greater than zero. The only time that there is no organisation is when the output equals the cost of the inputs.
Tuesday, 9 June 2009
Applications for MA Economic and Governmental Reform at the University of Westminster
Here's a reminder about applying and getting funded for the Master's course in Economic and Governmental Reform at the University of Westminster here in London, starting in October. I teach the economics modules on the course. African applicants are most welcome and have good performance records.
Our students have come from government, private sector, and NGO backgrounds, and after the course have moved on to senior positions in Africa, Europe, and beyond. Living in London itself offers many attractions and opportunities, of course.
Information on the course and obtaining funding is on its website (here). The course, like most in the UK, is expensive (GBP10,000), so students usually have applied for scholarships first. Course requirements are listed on its website, although there is some flexibility. Unavoidable ones are:
1. Reasonable English (or things won't make sense)
2. A first degree with some relevance to the topic, or a degree and relevant work experience
3. Willingness to work hard (or things will not be enjoyable)
Good luck with applications.
Monday, 8 June 2009
Is gender equality subject to localised international spillover?
I suggested in a post last week that institutions could be considered as technologies based on people. They may inherit some of the properties of technologies, and so today I considered whether institutions in one country tend to affect the institutions in other countries and whether the effect is altered by the distance between the countries. I examined a single institution, a country's gender equality, measured by the GEM indicator from the United Nations described here (in a 5.5 MB pdf document on pages one and six).
The equation I looked at was

where the suffixes denote the value of the quantity in country i or c. denotes the distance between country i and country c. The population multiplier allows for greater effects from larger countries.
The GEM indicator is available here. The distance data is from here, and is in the form of population weighted distances between two countries including internal distances (in tens of thousands of kilometres). Population (in tens of millions) and gdp per capita (in thousands of current PPP US dollars) is from UN sources here.
A cross section of countries was considered for the year 2007: Argentina, Australia, Austria, Bangladesh, Belgium, Belize, Botswana, Brazil, Bulgaria, Cambodia, Canada, Chile, China, Colombia, Costa Rica, Croatia, Czech Republic, Denmark, Dominican Republic, Ecuador, Egypt, El Salvador, Estonia, Ethiopia, Finland, France, Georgia, Germany, Greece, Honduras, Hungary, Iceland, Iran (Islamic Republic of), Ireland, Italy, Japan, Kazakhstan, Kyrgyzstan, Latvia, Lithuania, Malaysia, Mauritius, Mexico, Mongolia, Morocco, Namibia, Nepal, Netherlands, New Zealand, Norway, Pakistan, Panama, Paraguay, Peru, Philippines, Poland, Portugal, Russian Federation, Saint Lucia, Singapore, Slovakia, Slovenia, Spain, Sri Lanka, Sweden, Switzerland, Thailand, The former Yugoslav Republic of Macedonia, Trinidad and Tobago, Turkey, Ukraine, United Republic of Tanzania, Uruguay, Viet Nam, and Yemen. Estimation was by non-linear least squares with bootstrapped standard errors.
The results are shown in the table. P values are in brackets.

The first specification finds that a country's gender equality is positively linked with other countries' gender equality, with the link diminishing with distance. The geographic localisation is quite strong; the chi parameter implies that the effect of a country's GEM on another country's GEM halves over 320 kilometres. The sharpness of the decline suggests that interpersonal movements may be important in the link.
When GDP per capita is introduced as a control in the second specification, the intercountry link becomes highly insignificant. In specification three with only GDP per capita as an explanatory variable, the R2 is almost the same as in specification two, indicating that the effect of intercountry links are substantially captured by GDP per capita. The explanatory power of the regressions involving GDP per capita are also far higher than for the regression involving only the intercountry links. The evidence supports gender empowerment as being much more directly linked to internal GDP per capita than external spillovers. I have not attempted to find the direction of causality in any links between intercountry spillovers, GDP per capita, and gender empowerment.
As an application, a very gender equal country is unlikely to have a major influence on regional equality except insofar as it boosts income in its neighbours. It would be interesting to see whether other institutions such as democracy are determined far more by internal conditions than external spillovers.
Thursday, 4 June 2009
The locus of problem solving, search engines, and African marketplaces
From the late 1980s onwards, several high-profile research papers appeared looking at how businesses can best serve buyers when the businesses and clients do not know exactly what the other one knows or wants. When this happens, businesses may offer buyers a product or service that is not what the buyer wants at all. To get around the difficulty, businesses and buyers may work together on different parts of the product design, for example by businesses dealing with the parts they know best such as engineering processes and buyers dealing with the parts relating to specific design. The paper here discusses the issues and gives examples.
The research could have been used to anticipate the success of internet search engines. People know what they want to find out, and the search engine knows how to find it. The search engine does not provide a list of things the person might want to find without first asking them. The most successful search engine, Google, has a plain main page, for example. Search engines differ in the degree to which they equip the user for the second stage of user input, where the user clicks on a link to visit a website. I have mentioned the World Bank's basic search engine before on this blog, for providing not-very-helpful search results. The newly launched Bing search engine looks like it is making extra effort to provide the user with information so that the user's second stage of input is made easier.
The analysis can be applied to African marketplaces too. For example, a market chaotically arranged with no indication of where to find goods provides little scope for buyers to use their known purchase preferences. A market may provide a map or billboard with the positions of stalls indicated; buyers can use their knowledge to a greater extent but there might be limitations on them if the map is incorrect, or they cannot read well, or the map location is in an unsafe area. A market designed to give buyers the best opportunity for using their information might have pictures of the product types with arrows pointing clearly and accurately in the direction of the stalls, with the pictures displayed prominently throughout the market.
Distance, technologies, and institutions
Recent work on how technologies such as computers spread across countries has found that a country's productivity benefit derived from foreign technologies tends to fall off sharply if the source of the technology is far away. The effect is possibly due to lower trade or movement of people between distant countries compared with closer countries. Here is one paper finding such results. They depend on how much a country is able to absorb technology, for example whether it has a suitably educated workforce. The findings and their interpretations are still in development and there is uncertainty about them at the moment.
I suggested in a recent post that institutions could be considered as technologies based on people. The analogy raises the question of whether institutions have a similar spread over distance. Some of the diffusion mechanisms are the same and hence may display the same decline with distance. The distance effect on institutional diffusion is suggested by recent tendencies in democratisation after communism (Eastern Europe being most liberalised with decreasing liberalisation towards Asia), in conflict (spilling out of Rwanda, Uganda, and Sudan and into neighbouring countries), and in religion (with countries furthest from the Arabian Peninsula having less politicised religion).
I suggested in a recent post that institutions could be considered as technologies based on people. The analogy raises the question of whether institutions have a similar spread over distance. Some of the diffusion mechanisms are the same and hence may display the same decline with distance. The distance effect on institutional diffusion is suggested by recent tendencies in democratisation after communism (Eastern Europe being most liberalised with decreasing liberalisation towards Asia), in conflict (spilling out of Rwanda, Uganda, and Sudan and into neighbouring countries), and in religion (with countries furthest from the Arabian Peninsula having less politicised religion).
Sunday, 31 May 2009
Why is technology important for growth?
A technology tells a producer how to organise their inputs in order to make a good or service. Technology can cover many different things, such as: computers and other capital goods (where the information is contained in a box so the producer does not have to worry about understanding the methods); scientific theories; or ways of running an office. The broadness of the term and apparent intensive use in producing goods in developed economies suggest that it should be important for growth.
Econometricians who have measured its impact often say that it is. Getting technologies that increase output or technologies that combine well with other technologies has been found by some studies to be responsible for over half of economic growth worldwide. There is much uncertainty in the results. The way technology is usually measured in these estimations understates its role compared with a more commonsense understanding of its contribution, as if a new technology’s seller gets the extra income from the technology’s use, the extra income is said to be due to increases in capital rather than technology.
Econometricians who have measured its impact often say that it is. Getting technologies that increase output or technologies that combine well with other technologies has been found by some studies to be responsible for over half of economic growth worldwide. There is much uncertainty in the results. The way technology is usually measured in these estimations understates its role compared with a more commonsense understanding of its contribution, as if a new technology’s seller gets the extra income from the technology’s use, the extra income is said to be due to increases in capital rather than technology.
When is a banana not a banana?
When it is a banana collected for food and considered as a technological object. Technology theory tries to find ways of describing objects that help to explain how they interact with the rest of the economy. The following description of a banana could apply to many small scale technologies in Africa.
Its factors of production include tropical agricultural inputs and manual labour.
Its capital requirement for operation is low unless for large-scale production, with some of the capital being freely available and collectable by labour.
The knowledge requirement for operation is relatively low.
The embeddedness of the technology is high; the banana contains the chemical technology in it and the grower and harvester do not have to know and implement every detail. The operational skills are disembedded.
The geographic location of the technology source is local.
The protection on intellectual property is non-existent.
The costs of knowledge transfer is low for the banana itself; operational skills are also relatively inexpensive to transfer.
The social factors influencing the choice to grow and collect bananas may include the relatively low risk of production and its historical acceptance. I am uncertain of the role of social factors, however, for reasons of my own lack of knowledge, and because other constraints such as finance might be directing choices more than social factors.
Thursday, 28 May 2009
Teachers imparting ideology
There is a recent research paper (available here) on the role of foreign education in promoting or reducing democracy in a student's home country. The paper finds that students travelling to democratic countries for education is often followed by increased democracy at home, and the paper uses various analytical tests to show that a forward causal link is a strong candidate for explaining the results. The results indicate that students travelling to a less democratic country often leads to reduced democracy at home.
The change in democracy is presumably only part of the influence exerted by the host country on the source country. Other influences may relate to social norms or political allegiances. The author presents examples of where powerful countries have set up educational exchanges with the explicit aim of ideological promotion, often by changing the views of future political leaders. I think it may encourage cynicism by students if they and all their classmates are from “strategically important” countries.
I do not know whether students are affected by the teaching or the general experience of spending time in a country. Two possible mechanisms are broad ideological influence or by technological training (students return home knowing more about a political system and they want to apply something they know about rather than something they do not). If the latter mechanism is the most important, then teaching may be more important than general influence since many or most teachers are appointed as technocrats rather than ideologues. Many teachers including me would be uneasy with a role of ideological promotion for the state.
"Education as ideological alignment" is one possible reason why states sponsor international students, but there are other possibilities. Foreign students have been found to be associated with increased economic innovation in their destination country (described here). This explanation seems to be equally compatible with a self-serving view of country educational funding. A country may also have humanitarian motivations.
Institutions as technologies based on people
Much recent research has emphasised the role of institutions in promoting various forms of economic development. Institutions include organizations like governments and companies, but also abstract guides to human interaction such as laws and moral codes.
Institutions describe something that is intangible, relates to human interaction, and does not have an obvious causal effect on the outcomes with which it is linked. So modelling them can be difficult. An approach used in the research paper here (on page 11) is to attribute to them one of the characteristics of technologies (themselves definable as the information about and organization of resources used to produce goods). The approach presents institutions as containing embedded knowledge, so that people do not have to find out how to operate with other people every time they want to interact.
The approach may be extended to identify institutions more closely as technologies with people as the resources. It is appealing because it gives a precise representation of the quite loose idea of institutions, and institutional analysts can use the tools of technological analysis.
Monday, 25 May 2009
Free market research on opinions in African countries
I am looking at why certain countries accept technologies more readily than others. There is research saying that education is important for some sorts of technology and other research finding that distance from the source of the technology is also important. One candidate factor influencing acceptance is the general attitudes of people in a country. If people in a country do not like risk much, then they might be more reluctant to accept new technologies. If people do not value healthcare much, then trying to sell a home medical kit might be more successful in a more health-conscious country.
The World Values Survey is helpful for assessing attitudes. The survey is available here, based mainly on interviews with statistically selected respondents from what I can see. There is information on South Africa, Ghana, Egypt, Burkina Faso, Ethiopia, Mali, Rwanda, and Zambia from the most recent survey and on Tanzania from the previous survey, so it is helpful for assessing different opinions particularly in the Saharan West African and Southern Great Lakes regions. As a few examples, 44.6 percent of Malians say they strongly agree that they would give up part of their income for the environment while only 12.7 percent of Zambians strongly agree. 36.1 percent of Ghanaians say they completely agree that science and technology are making lives healthier, easier, and more comfortable compared with 16.8 percent of Rwandans. 38.2 percent of Ethiopians say they read a book in the week before the survey, compared with 21.0 percent of South Africans.
The World Values Survey is helpful for assessing attitudes. The survey is available here, based mainly on interviews with statistically selected respondents from what I can see. There is information on South Africa, Ghana, Egypt, Burkina Faso, Ethiopia, Mali, Rwanda, and Zambia from the most recent survey and on Tanzania from the previous survey, so it is helpful for assessing different opinions particularly in the Saharan West African and Southern Great Lakes regions. As a few examples, 44.6 percent of Malians say they strongly agree that they would give up part of their income for the environment while only 12.7 percent of Zambians strongly agree. 36.1 percent of Ghanaians say they completely agree that science and technology are making lives healthier, easier, and more comfortable compared with 16.8 percent of Rwandans. 38.2 percent of Ethiopians say they read a book in the week before the survey, compared with 21.0 percent of South Africans.
When does a new product displace an old one?
Suppose someone has invented a new product that is better than one already in the market. Will people start buying the new product instead of the old one?
It depends on what is meant by better. If “better” means that whenever the new product has the same price as the old one it has a higher quality, or alternatively whenever it has the same quality as the old good it is cheaper, then it will displace the old good completely when purchases occur.
“Same quality” or “higher quality” are precise in their meaning here too. Same means identical in every way, while higher quality means better in every way. Quality includes consumer knowledge of the good, so that the two products are equally well known and trusted. For a new product, the level of consumer awareness may be lower than for the old product.
If the new product is not as good as or better than the old one in every way, then there will be some criteria other than price determining the choices of consumers in favour of the old product. The products are not perfect substitutes, so the old product and the new product will both be bought in the market with relative proportions depending on how many points the new product is better than the old one.
Mathematically inclined readers may find the model used in some economics papers informative. The choice between goods is modelled by a constant elasticity of substitution between the old and new goods, which is combined with Shephard’s lemma to calculate a demand for each type of good. The specification is helpful in connecting the demands for new goods domestically and internationally since the same type of choices drive both.
Saturday, 23 May 2009
Does economic growth create goods from nothing or take them from someone else?
An economy grows at a certain percent per year; the extra or better quality goods must have come from somewhere. If the goods cannot be newly created by some method, they must have been taken from someone else, so that an economy’s growth comes at the cost of someone else’s impoverishment.
An economy can be considered as a machine powered by energy from the Sun and other raw energy sources. The machine produces goods. Some of the goods are broken down (consumption). Some of the goods are put aside to make new goods (accumulation), so that the future stream of new goods is higher. Other goods are used to try different arrangements of the machine’s mechanics to see if the different arrangements increase the stream of new goods (technological improvement).
These last two steps create new goods from the raw energy sources, not from nothing. When they lead to economic growth, what is measured is the extent to which rearrangements of resources in the last year have caused the energy to be used in a particular way. Growth can be viewed as a measure of change in use, not of creation.
How productive is a machine?
Productivity in economics measures the amount of output for a certain amount of input. So a machine may have a productivity of, say, two kettles or televisions for every machine employed.
Companies and people are not born tied to a fixed machine that they can never exchange; generally, they can buy and sell machines at market. So the value of the input machine can be compared to the value of the output. The two kettles might be worth $50 and the machine might be worth $40, so we can measure the productivity as $10. There are a variety of ways of measuring productivity in numbers, such as saying it is $50 divided by $40 instead of the $50 minus $40 here.
The value of the machine is decided in market exchanges, and hence so is the productivity of the machine. It depends not just on the cost of raw materials used to make the machine, but also on the market power of the buyers and sellers. So a machine in a monopoly market may be less productive than the same machine if the market was competitive. The cost of the outputs is the same, but the cost of the inputs is different.
Thursday, 21 May 2009
World and DR Congo book publications
I looked again at the book publication data mentioned in my post-before-last, and drew up a table of world publications from 1995 and compared them with DR Congo publications from the same year. The table is below.
The Congolese publications are in subjects involving much less physical capital or formal education in their preparation than the world publications, and consequently leading to less transfer of the knowledge about subjects involving them. I am not sure how much of the division is due to supply (writing interest and expertise) or demand (reader interest) in the DR Congo.

The Congolese publications are in subjects involving much less physical capital or formal education in their preparation than the world publications, and consequently leading to less transfer of the knowledge about subjects involving them. I am not sure how much of the division is due to supply (writing interest and expertise) or demand (reader interest) in the DR Congo.

Sunday, 17 May 2009
Is mining investment the right sort of FDI?
Many governments look to promote foreign direct investment in their countries. It could create employment while it is there. However, if its only contribution to the economy is a temporary inflow of cash and it does not leave any long term benefits, then perhaps it is not leading to any real development. A potential long term benefit of fdi is through the skills imparted to employees and local partners, and exposure to foreign methods and technologies. When the fdi stops, these benefits may remain. They may even spread further through the economy while the fdi is still present.
Economists have looked at what sort of companies bring such long term benefits. One prominent paper finds that Western business research and development - a major source of commercial innovation - is highest in the chemical, machinery and electrical machinery, and transportation industries. Looking at European companies with many patents (the data is here - the database is very large), we can find that the most patents are owned by Siemens, Philips, BASF, and Bosch. These companies are prominent in the industries just mentioned.
Africa gets much of its fdi in the form of mining investment, and the extracted minerals are often processed outside the continent. So it may not be exposed to advanced technologies through its inward fdi. In that sense, its fdi is the wrong sort. The problem is compounded by the high capital to labour ratios in some forms of mining, since contact with the local population and opportunites for learning and technology diffusion are limited.
A caution is that concentrating too much on patent ownership may be misleading. Some forms of technology are not patentable, such as industrial organisation techniques and these can be present in any company inside or outside the high-research industries. They may diffuse outside the company. Some companies invest in schools and similar projects as local goodwill, and smart governments can maximise local involvement in projects. Mining investment may not be the best form of fdi for generating long term development, but its benefits do not have to stop when the minerals run out either.
What type of books are being published in Africa?
UNESCO published figures on book publications by country and theme, with the most recent data from the late 1990s. The data is over at the UN data site here.
A dozen African countries are included. For those countries, I rearranged the data a bit to list what types of books were published most in the countries. It is a crude indicator of national interest in books; many books may be imported, but publishers have spotted a strong interest in a particular type. The results are shown below. A few small-publishing countries emphasised literature, while the other nine led on scientific publications.

A dozen African countries are included. For those countries, I rearranged the data a bit to list what types of books were published most in the countries. It is a crude indicator of national interest in books; many books may be imported, but publishers have spotted a strong interest in a particular type. The results are shown below. A few small-publishing countries emphasised literature, while the other nine led on scientific publications.

Thursday, 14 May 2009
Africa's consumption distribution by country
Courtesy of the African Economic Outlook website here, the table below shows the consumption share of the richest ten percent of the population in African countries. Southern African and English speaking countries tend to be among the more unequal, while Francophone countries tend to be more equal. English speaking countries worldwide are often less concerned with inequality; I am not aware of any English speaking country which has had a communist government, for example. If the link is robust, it may be due to colonial heritage or possibly post-colonial links with other Anglophone countries.


Annual AfDB and ADF meeting, and a compact online African database
The African Development Bank and African Development Fund annual Board of Governors meeting is taking place yesterday and today. There are already dozens of press releases, reports, interviews, and speeches on the AfDB website here. With luck, there will be a condensed final report produced for general consumption.
There's a new website just launched to complement the release of the 2009 African Economic Outlook report. It has a convenient page of economic and related demographic data here.
There's a new website just launched to complement the release of the 2009 African Economic Outlook report. It has a convenient page of economic and related demographic data here.
Sunday, 10 May 2009
New medicines cost tonnes, take ages, and there are hardly any of them
I was reading through the literature on technology and came across some papers on research and development of new medicines. I had a general idea that they were expensive, but the papers here and here present data that has new medicines produced in the United States costing almost a billion dollars each, taking over a decade, and numbering only a few dozen per year.
Many anti-malarial medicines are chemically similar to quinine, and it is feasible that new medicines could be found by changing chemical structures by relatively small amounts. In this case, it would be easy to produce new medicines based on old ones. If such small modifications account for many of the new medicines, then the number of genuinely new medicine pathways is tiny. Some new medicines are derived from plants, so the rate of finding new laboratory-derived pathways seems tiny.
Many anti-malarial medicines are chemically similar to quinine, and it is feasible that new medicines could be found by changing chemical structures by relatively small amounts. In this case, it would be easy to produce new medicines based on old ones. If such small modifications account for many of the new medicines, then the number of genuinely new medicine pathways is tiny. Some new medicines are derived from plants, so the rate of finding new laboratory-derived pathways seems tiny.
Thursday, 7 May 2009
Applications for MA Economic and Governmental Reform at the University of Westminster
Here's a reminder about applying and getting funded for the Master's course in Economic and Governmental Reform at the University of Westminster here in London, starting in October. I teach the economics modules on the course. African applicants are most welcome and have good performance records.
Our students have come from government, private sector, and NGO backgrounds, and after the course have moved on to senior positions in Africa, Europe, and beyond. Living in London itself offers many attractions and opportunities, of course.
Information on the course and obtaining funding is on its website (here). The course, like most in the UK, is expensive (GBP10,000), so students usually have applied for scholarships first. Course requirements are listed on its website, although there is some flexibility. Unavoidable ones are:
1. Reasonable English (or things won't make sense)
2. A first degree with some relevance to the topic, or a degree and relevant work experience
3. Willingness to work hard (or things will not be enjoyable)
Good luck with application.
Is the patent information enough for technology diffusion?
I have posted links to developed country patent offices in recent posts. The motivation is that African entrepreneurs and inventors can build on the inventions in developed countries. My last post pointed out one limitation of doing so, namely that there may be adaption costs if the technology is not well suited for Africa. Another set of costs arises not from adaption, but just adoption, so that even if the technology was ideal for Africa's circumstances there would still be expenses to learning and using it.
A technology's tacitness can raise adoption expenses. It means that the information used in the technology is not written down. A stricter definition is that the information could not possibly be written down. In the first definition could fall difficulties such as an incomplete patent specification; in the second definition lies problems such as the practical inability in a reasonable time period to fully specify all the operational requirements of a system. Imagine a machine construction guide - it may never state that a power supply is required, rather being taken for granted, but if someone has never built a machine before they might wonder why their machine doesn't work despite being perfectly built according to the patent.
A second problem belonging to the "can't be written down" tacitness is that even if someone knows exactly a design they may not be able to implement it well without extensive practice. An example might be in language learning; knowing the words and grammar is great, but it can still take forever just to say the most basic sentences. Technological fitness through repetition as well as design information is required to implement the design.
Problems like the ones described tend to reduce with experience: an inventor can fill in the holes in a patent specification; they know what the designer was thinking; they are already well practised in related technologies. The importance of experience explains why research and development even in developing countries can be important in promoting growth. The idea is not to produce technologies specific for the most advanced countries, but rather to understand foreign technologies and get them to work as well as possible locally.
Subscribe to:
Posts (Atom)